The Aegean region provides an ideal model area for measuring the relationship between amount of genetic divergence and time of spatial isolation, because the geology is well known, a nested set of isolation times between 10,000 y and 5 My is available, and the region is inhabited by the genetically well-investigated group of western Palearctic water frogs (Rana esculenta complex). Dispersal between populations on each of the two mainlands (Europe and Anatolia) can easily occur. All islands situated on the continental shelf (in this study: Samos, Evvoia) were connected by land to the adjacent mainland several times during the Pleistocene cold phases. The greatest fall in the sea level (200 m below current level) during the maximal glaciation also raised land bridges between the islands Ikaria and probably between Kithira and Andros and their adjacent mainlands. The islands of Crete, Karpathos, and Rhodos have been isolated since approximately the end of the Miocene (5 My), the middle Pliocene (roughly 3 My), and the beginning of the Pleistocene (1.8 My), respectively.
Protein electrophoresis of 31 genic loci revealed the following phylogenetic structure calculated with a maximum likelihood procedure: (((((((Rana ridibunda [Europe], Rana bedriagae [Anatolia]), unnamed Karpathos taxon [including Rhodos]), Rana shqiperica), Rana epeirotica), Rana lessonae), unnamed Cretan taxon), (Rana perezi, Rana saharica)). This structure is also supported by a least square algorithm (except for the grouping of Rana perezi and Rana saharica) and by a cladistically derived tree. In all cases samples from the shelf islands are sister taxa to the adjacent mainland populations.
The number of loci used in this study (31) is phylogenetically informative, as shown by a randomization study: the sum of squares of the least square algorithm converges to a value near to the minimum possible between 20 and 25 loci and to that obtained with the complete locus set.
Within-species comparisons between the genetic distance and the geographical distance revealed a positive correlation and support an [[ordfeminine]]isolation by distance[[ordmasculine]] model.
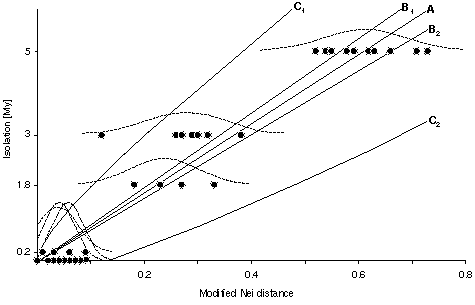
Using pairs of neighboring populations, a linear relationship between geographical isolation time and genetic distance was found: D*Nei = (0.027 [+-] 209;0.027) + (0.114Ñ0.008) . isolation time [My], isolation time [My] = (-0.04 [+-] 0.22) + (8.146 [+-] 0.548) . D*Nei, corresponding to an average divergence rate (molecular clock) of 0.14 D*Nei / 1 My and 8.1 My / 1 D*Nei. This rate is slightly higher than that of previous estimates reported for protein electrophoretic data, but the value is conservative since relatively few of the loci used are `fast evolvers' (13%; sAAT, ALB, EST-5, MPI). Removing the `fast evolvers' from the analysis results in 9.4 My / 1 D*Nei. A test in the outgroup Rana perezi and Rana saharica (isolated since 5 My by the Strait of Gibraltar) fits relatively well into the calibration: observed genetic Nei distance D*Nei = 0.55, DNei = 0.56, expected D*Nei = 0.60. Connecting the isolation time scale with the branching pattern of the phylogenetic tree suggests a rapid sequence of speciation events after the Messinian (5 My), possibly triggered by the rapid ecological changes accompanying the salinity crisis (deep desiccated basin model) of the Mediterranean Sea.
The data obtained on phylogenetic relationships and genic divergences will be important for our studies aiming at an evolutionary understanding of the initiation of clonal reproduction occuring in hybrids of this group of frogs. The estimated divergence rates can subsequently be compared with those of other groups of organisms in the same area, for which salt water is a dispersal barrier as well, and will thus provide the basis for a direct test of the molecular clock hypothesis.

Fig. Geological isolation time versus genetic distance (D*Nei). Regression line (A: (-0.04 [+-] 0.22) + (8.146 [+-] 0.548) . isolation time); B1 and B2 are the bounds of the 95% confidence limits of the regression line; C1 and C2 are the bounds of the 95% confidence limit for the prediction of time based on new genetic distance data (cf. Hillis and Moritz 1990). The dashed lines provide the frequency distribution of the genetic distances approximated whith a normal distribution. The height of of the frequency distribution is relative and not correlated with the Y-Axis.